- DATE:
- AUTHOR:
- The Distribution Innovation team
Routesummary2, embedded Tableau, new emissions report, shared data
Happy Thursday DAPper ladies and gents!
Quite a lot of big updates to report on today, so I'll jump straight to it:
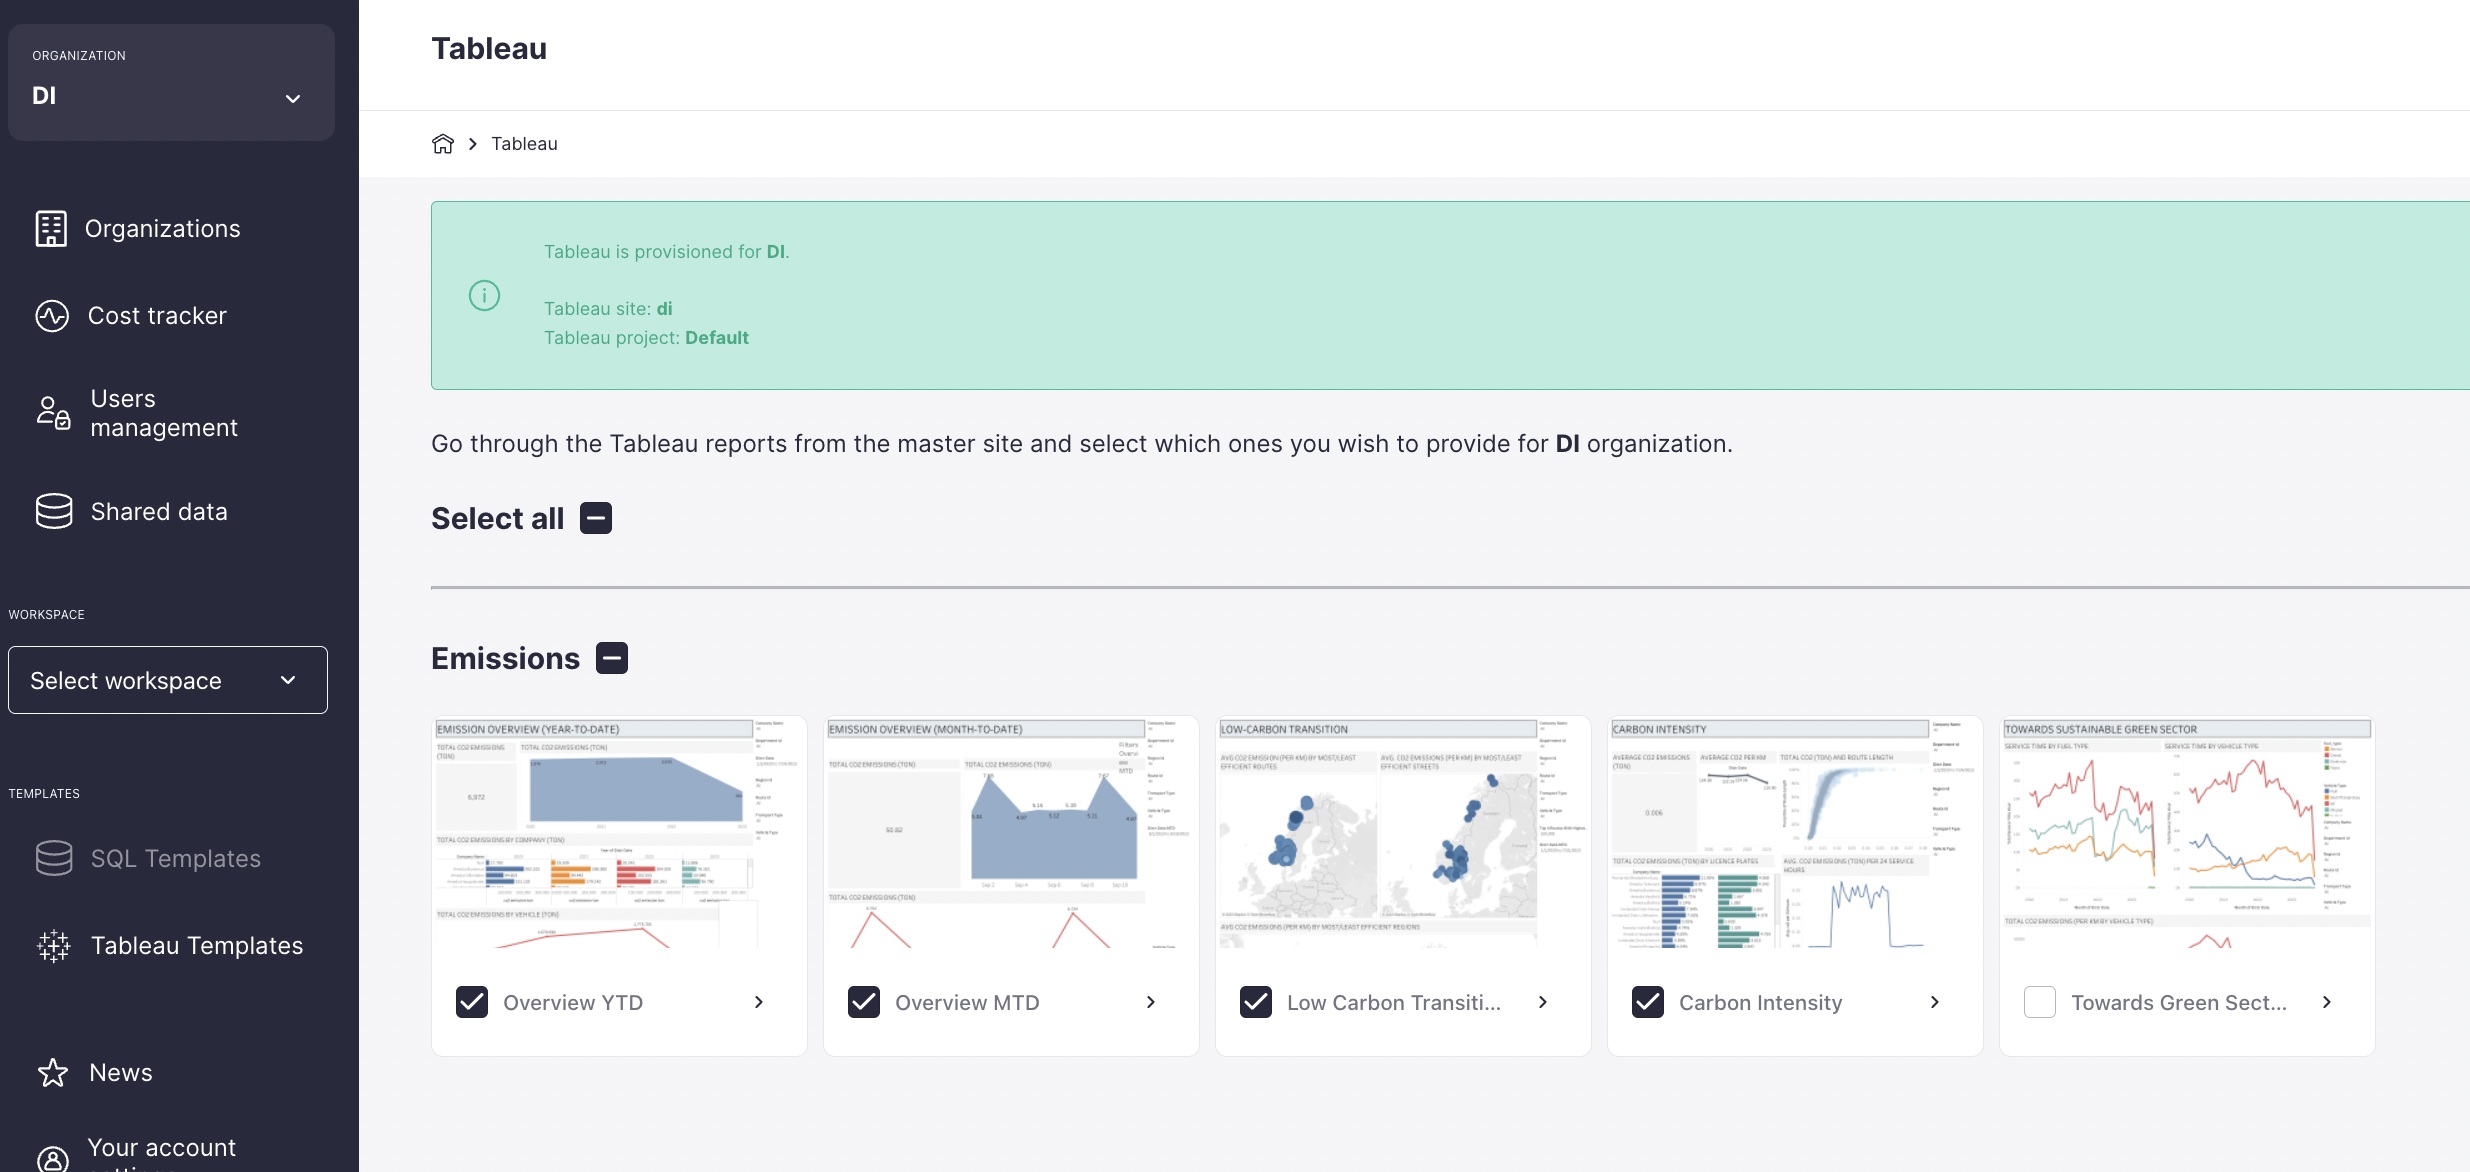
Embedded Tableau and new Emissions dashboard
Tableau is now properly embedded in the web application, and we have built the necessary functionality to share any Tableau dashboards we create with you .
Access to dashboards will require a subscription, and a personal Tableau license. The first dashboard in the library is a new Emissions dashboard with lots of exciting plots and views, but we are eager to hear your feedback about how it can improve and whether there are important plots you feel are missing. Reach out if you want to learn more!
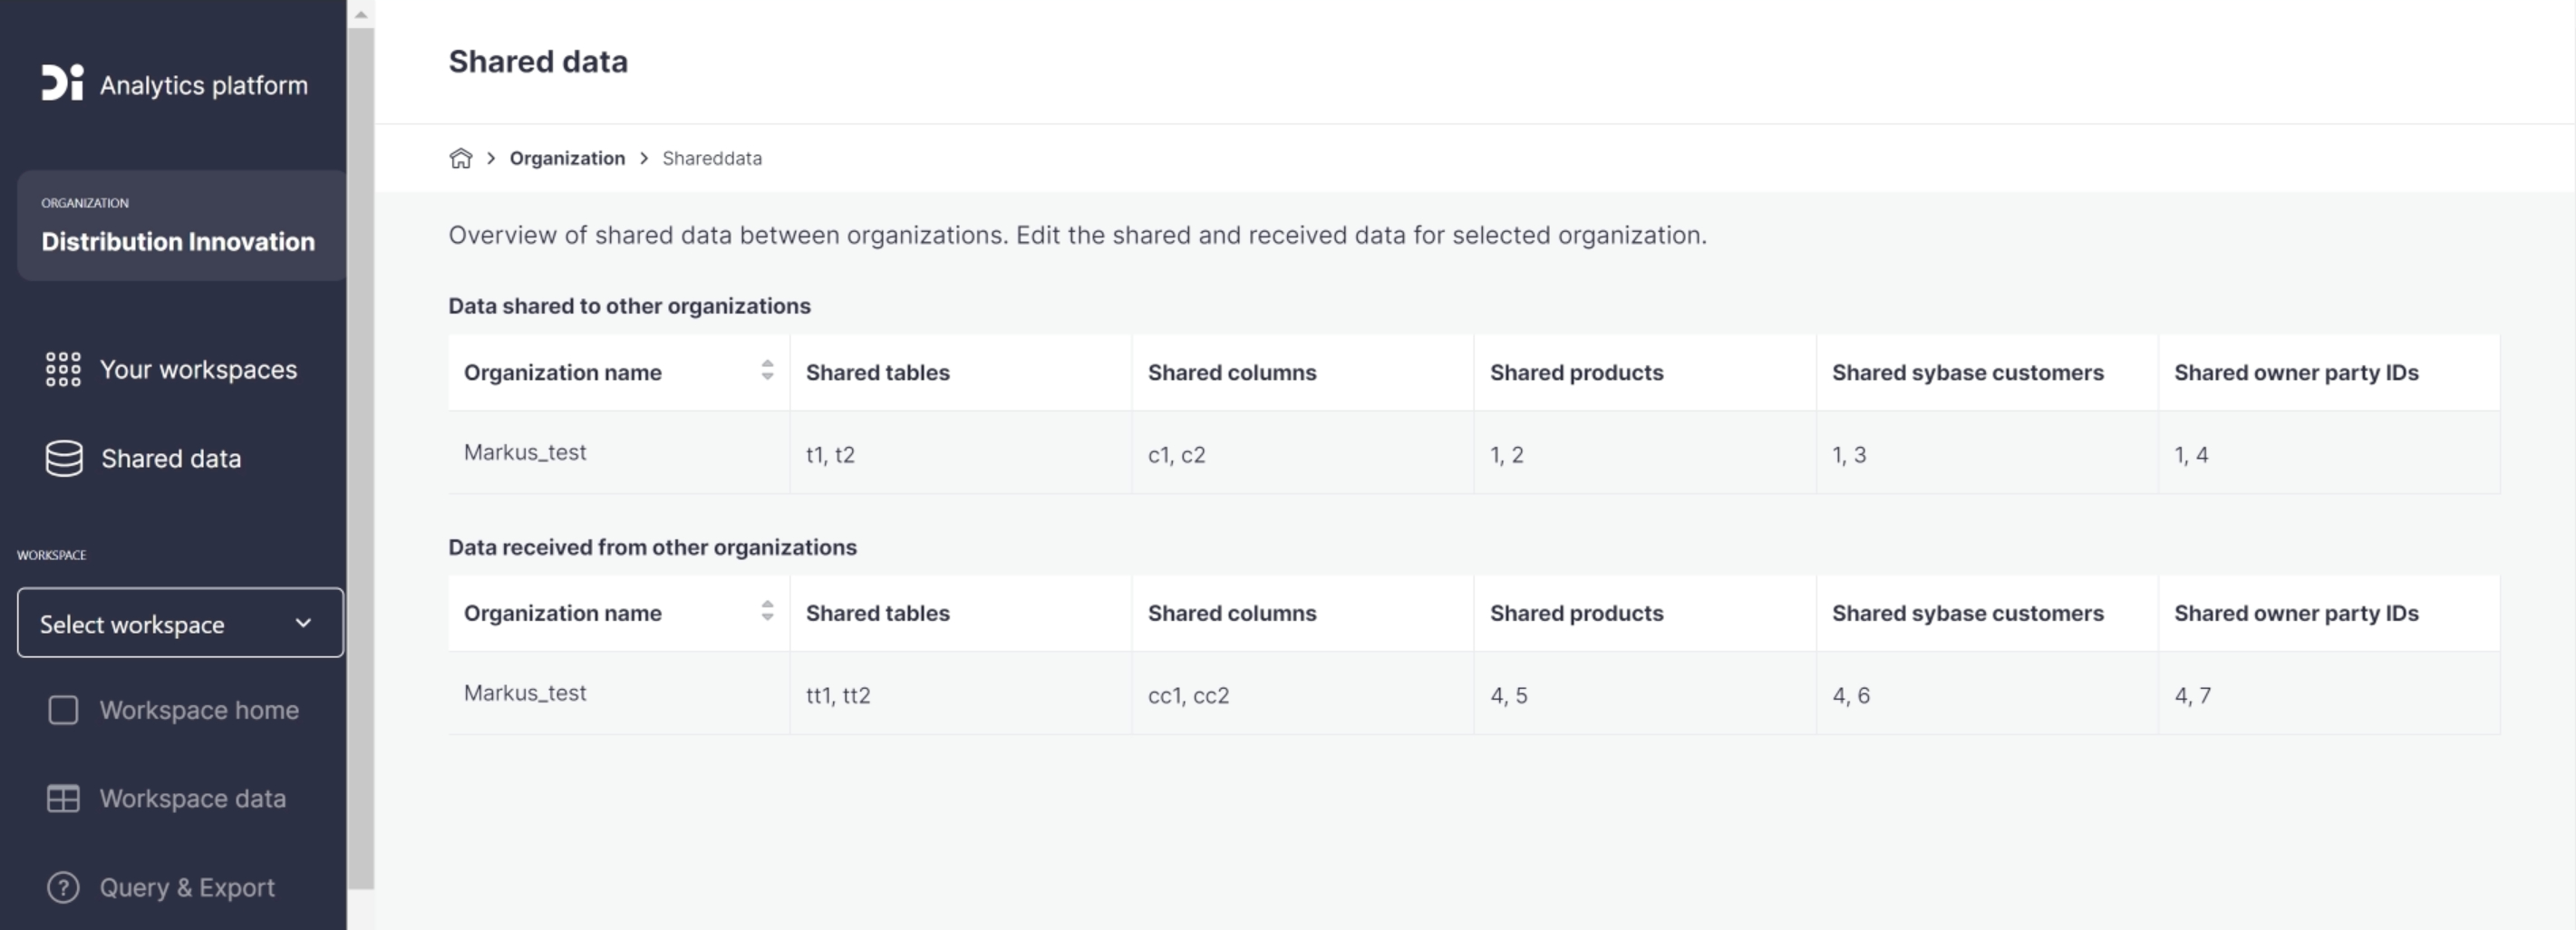
New tab: Shared Data
One important obvious benefit of having all your data in a self service cloud platform is the ease of which you can share data between teams in your company, or with others. This has always been a feature of DAP, and many of you are already using it. We recently released an update to the web app where you can keep track of which data you are sharing to whom and which data you are receiving from other companies.
Click the "Shared data" tab to inspect.
Data model changes:
New Table: DeliverySchedule
This table is your go-to source for tracking the delivery days of specific product groups to various delivery points throughout the week. This feature becomes especially valuable when you need to strategically exclude certain addresses (based on delivery points) for specific product groups on specific days of the week.
Additionally, you can expand your insights by joining this table to our productgroup table
New column in planneddelivery: published_date
The date when products such as newspapers or magazines are published or released. The purpose of this column is to account for ‘Geo adjustments,’ which means that in advance, we adjust the distribution date to a later date because of certain factors. For example, when the distance from the distribution station to the end-customers is too far, it may require extra time or days for distribution.
Routesummary
This table has been one of the core tables since the birth of DAP. When it was first designed, we wanted to make sure the data here reflected what had definitely happened on a route. For this reason, the table was based on data from our payroll system, and contained a lot of employee info. The philosophy was that if someone has received a salary for this route, then we definitely know that this is what happened.
This approach did cause a few issues. First of all, not all distributors utilize DIs payroll system, meaning Routesummary for specific routes would not contain data in DAP simply because we were lacking that data, even though we would know a lot of the other data points for that route.
Secondly, for the companies that do utilize DIs payroll system, data would typically be updated only when salaries were computed and paid out, meaning the route summary table would only get updated monthly, weekly or sporadically, depending on when the internal process took place.
To mitigate this, we have redesigned the entire table, and are happy to report that the new and improved Routesummary2 will not only contain data for more routes, it will also be updated daily. In order to achieve this feat, a few more tables have been generated in DAP to act as support. they can be joined in whenever necessary to recreate all columns in the "old" routesummary. Planned work needs to be combined with absence tables to calculate the actual employee who worked that route.
Example queries below (replace common with your organisation name):
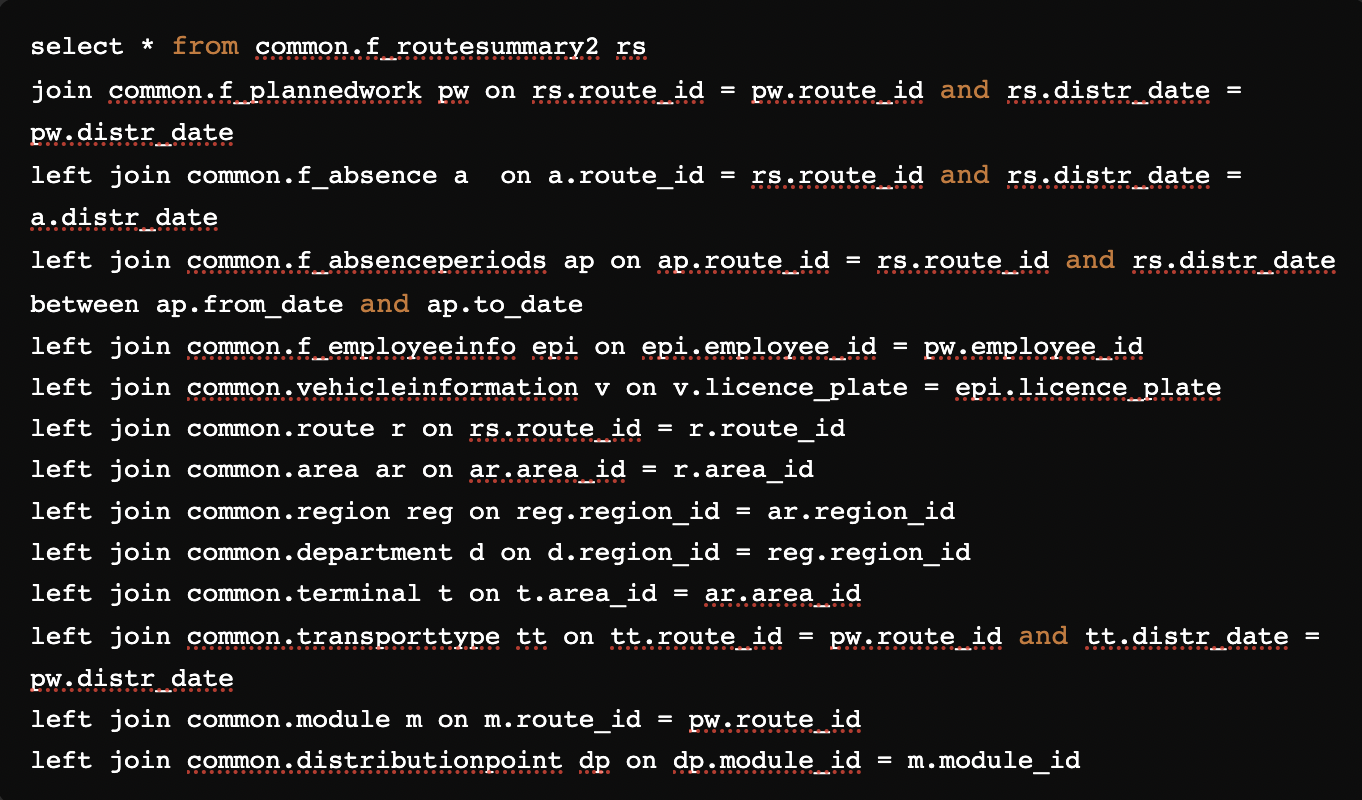
Routesummary2 is live on PROD today, and we would appreciate feedback from you, our users. In particular, we would ask you to test the new Routesummary2 table against the old Routesummary, look both for missing data and new data that you hadn't seen before. Secondly, we would like feedback on the approach of maintaining a rather "small" Routesummary2 and joining in support tables when needed, or whether one or more of the support tables would be better integrated in Routesummary2. We could tweak the ingestion job to do one or more of those joins automatically if necessary.
The plan is to maintain both tables for a while until we (and you!) are confident that the new table works as intended, and then communicate a time for EOL of the old Routesummary.
Historical data update
Mid September we updated 10-15 tables with a lot of historical data, intended to fix a number of inconsistencies and bugs, and (obviously) to give access to more of the historical data we have.
This update caused a few unfortunate issues with the queries you have become accustomed to using and caused som confusion, so we quickly decided to revert the update. We are working on a way to release the historical data in a smoother fashion, with some more filters and tweaks. First up are the tables plannedwork and absenceperiods, which will have history released tomorrow!
Wish you all a nice weekend
Eirik Lyngvi
Head of Analytics